Wave Compare
Wave Compare places a floating-point reference WAV side-by-side with one or two fixed-point ports and surfaces the differences three ways: as overlaid waveforms, as a spectrogram, and as per-channel MLD, MAD, and SSNR metrics. Use it after you've built a fixed-point port to verify the output matches the reference and to find where it drifts.
The numbered badges around the screenshot are clickable — each one jumps to its section in the Interface reference below.
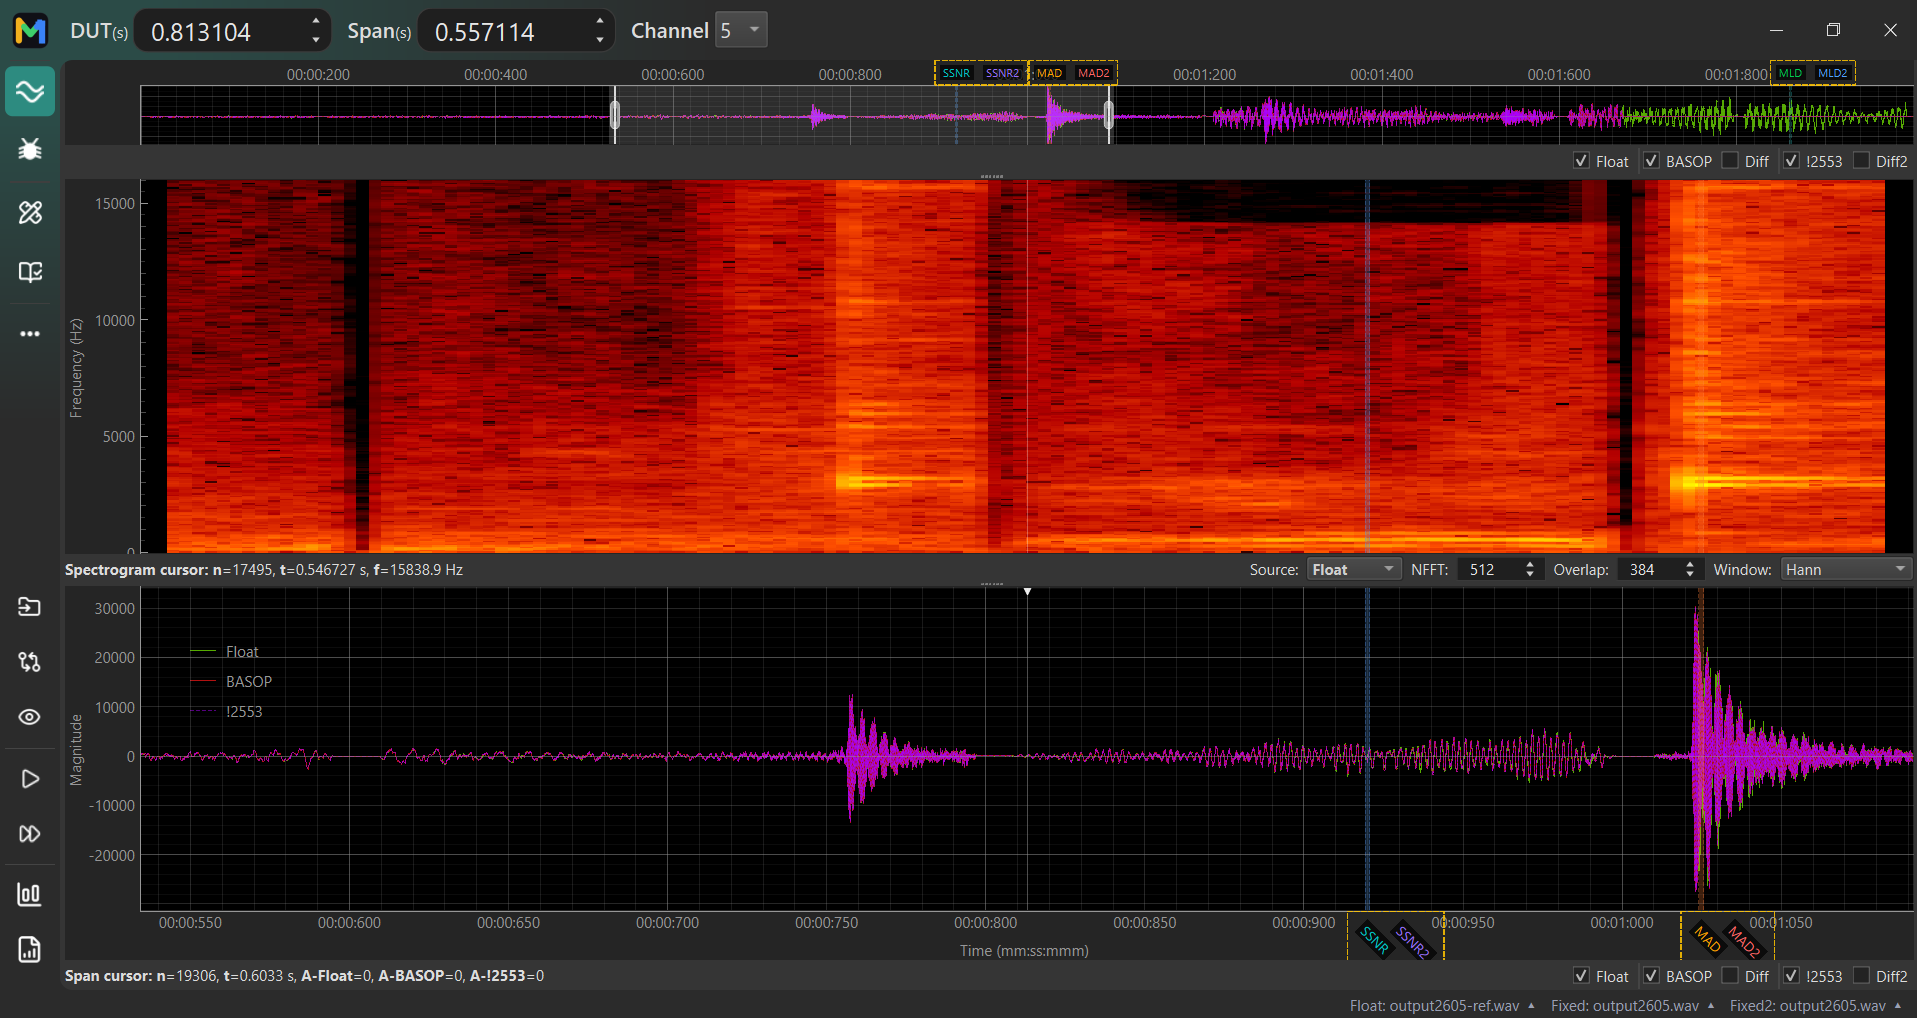
Quick start
To compare two WAV files for the first time:
- Click Toggle Files panel in the left rail and load your Float reference and Fixed candidate.
- Click Run MLD / MAD / SSNR analysis. Mantissa computes the metrics for every channel and drops markers at the worst-mismatch samples.
- Click any marker (SSNR, MAD, or MLD) on the all-view (#3) to jump the DUT spinner to that sample.
- Inspect the zoomed waveform in the span panel (#7). Hover anywhere for a per-sample read-out (#8).
Tip. If your fixed file is regenerated each time you rebuild, toggle Live mode — Mantissa reloads and re-compares automatically on every save.
Common workflows
Locate where a port deviates from its reference
- Load the reference and the port, then run analysis.
- Read the per-channel MLD in the Report ( Report button) to find the worst-affected channel.
- Switch to that channel via the Channel dropdown (#1).
- Click the MLD marker on the all-view to centre the span on the worst sample, then zoom in on the span panel to see the deviation at sample scale.
A/B-listen to differences
- Load the two files and tick Play span only in the status row so playback stays focused on the slab you're inspecting.
- Click Play… and pick either Float or Fixed from the menu to listen to a single side.
- Or click Play & Compare to have Mantissa alternate between Float and Fixed in 5-second chunks — your ears flag the diff faster than any metric.
Compare two fixed-point ports side-by-side
- Load a Float reference, a Fixed candidate, and a second Fixed2 candidate (e.g. a previous-build reference vs the current build).
- Run analysis. The Report now shows MLD/MAD/SSNR for both Fixed vs Float and Fixed2 vs Float.
- Toggle individual curves on/off via the overlay checkboxes (#6) to isolate each port's behaviour, or leave them all on to spot where one port diverges from the other.
Wire Mantissa into a CI / build loop
- Have your build script overwrite a fixed path (e.g.
out/fixed.wav). - Load that path as the Fixed file once and toggle Live mode.
- Every rebuild now triggers an auto-reload + auto-compare. The metric markers and Report stay current without your involvement.
Interface reference
1 — Title bar
The strip across the top of the window carries three numeric controls that govern what every panel displays.
- DUT(s) spinner
- Sets the Device Under Test time, in seconds — the centre of the zoomed span panel (#7). Type a value or use the ▲▼ arrows for fine adjustment. Clicking a metric marker on the all-view (#3) also drives the DUT here.
- Span(s) spinner
- Sets the width, in seconds, of the slab shown in the span panel. The slab is drawn between the two grab handles on the all-view.
- Channel dropdown
- Selects which channel of a multi-channel WAV to plot. Mono files
show only
1.
2 — Action buttons (left rail)
Wave Compare's own toolbar. Buttons are arranged in the order of a typical session: load files, compare, listen, analyse, report.
- Toggle Files panel
- Opens the file-loader sidebar. For each of Float / Fixed / Fixed2, a path box, Browse… button, and a ▼ recent files menu of the last ten paths used in that slot.
- Compare
- Re-runs the per-sample diff over the currently-loaded files and refreshes every plot and marker. Use after swapping a Fixed file without rerunning the full MLD analysis.
- Live mode
- Watches the Fixed file's modification time and automatically reloads and re-compares whenever it changes. Lit red while live.
- Play…
- Pops a menu next to the button listing the loaded sources (Play Float, Play Fixed, and Play Fixed2 when active). The icon flips to a red stop chip while playback is running; click again to stop. The Play span only tick in the status row controls whether playback is restricted to the highlighted slab.
- Play & Compare
- Alternates Float and Fixed in 5-second chunks for A/B listening. Skips the source-picker because alternation is the entire point.
- Run MLD / MAD / SSNR analysis
- Computes the per-channel metrics using
wav-diff(or the bundledmld-nativeon macOS/Linux). When the analysis completes, markers appear on the all-view (#3) and the span panel (#7), and the Report button activates. - MLD / MAD / SSNR Report
- Disabled until analysis runs. Once data exists, opens a separate window with the per-channel metric table, worst-channel callout, and Copy / Export CSV actions.
3 — All-view panel
The narrow strip across the top shows the entire file from sample 0 to the end. Serves as a navigation map for the rest of the interface.
- Curves. Float in green, Fixed in red, Fixed2 in magenta-dash. Each is toggleable via the overlay checkboxes (#6).
- Time axis. Formatted as
mm:ss:mmm. Hovering shows a vertical hairline plus the sample under the cursor (#8). - Span handles. Two vertical handles delimit the slab shown in the span panel below. Drag either to resize the slab; drag between them to slide both at once. Right-click the all-view for Set span here and Fit span to view shortcuts.
- Metric markers. SSNR, MAD, and MLD markers (and their Fixed2 counterparts SSNR2, MAD2, MLD2) appear after analysis, each at the sample of worst mismatch for its metric. Clicking a marker drives the DUT spinner to that sample and centres the span panel on it.
4 — Spectrogram panel
STFT magnitude over the current span. The hotter the colour, the higher the energy in that frequency bin at that time.
- Axes. Y is frequency (0 to Nyquist); X is time, aligned with the span panel below.
- Cursor. Hovering updates the cursor read-out (#8) with the time, bin, and frequency under the mouse.
- Wheel zoom. Plain wheel zooms both axes around the cursor. Shift+wheel zooms only the time axis; Ctrl+wheel only the frequency axis.
- Right-click menu. Plot Style (colormap, dynamic range), Export (PNG or SVG), Set Range (type explicit axis bounds for screenshotting at a known scale).
5 — Spectrogram controls
Configure the STFT below the spectrogram.
- Source dropdown
- Selects which buffer is transformed — Float, Fixed, Fixed2, Diff, or Diff2.
- NFFT spinner
- Window size in samples. Larger values give better frequency resolution; smaller values give better time localisation. Common defaults: 512 for speech, 2048 for music.
- Overlap spinner
- Samples shared between consecutive windows. Higher overlap produces a smoother time axis at the cost of more computation. Typical values are 50–75 % of NFFT.
- Window dropdown
- STFT window function — Hann, Hamming, Blackman, etc. Hann is the default and a safe choice for most audio.
6 — Overlay checkboxes
Toggle each curve in the all-view and span panels. The row reads as Float | Fixed Diff | Fixed2 Diff2, with thin grey separators grouping each Fixed with its corresponding Diff so the visual binding between them is clear.
Note. The separators appear only when Fixed2 is enabled. With Fixed2 off, the row collapses to Float Fixed Diff.
7 — Span panel
Zoomed view of the slab selected on the all-view. Use this panel for sample-level inspection.
- Shares the same per-curve overlay checkboxes (#6) as the all-view.
- Legend in the top-left lists the visible traces with their file-name labels (e.g. Float, BASOP, !2553). To change a label, edit the name field for that slot in the Files panel.
- Right-click menu. Plot Style (per-curve colour, opacity, dash pattern —
persisted across sessions in
settings.json), Export (PNG or SVG snapshot of just the span), Set Range (explicit X / Y bounds).
8 — Cursor read-out
Below the spectrogram and the span, a live read-out tracks the mouse position:
- Spectrogram cursor.
n=… t=… s f=… Hz - Span cursor.
n=… t=… s A-Float=… A-Fixed=… A-Fixed2=…— sample index, timestamp, and each curve's amplitude at the mouse position.
9 — Status row (file paths)
The thin strip across the very bottom of the window shows the three loaded file names (Float, Fixed, Fixed2), elided when the paths are long. The Play span only toggle and any transient status messages also live here.
Additional panels
Files panel
Hidden by default. Open it via Toggle Files panel (#2). The panel offers, for each of Float / Fixed / Fixed2:
- A path text box — paste or drag-drop a file onto it.
- A Browse… button.
- A ▼ menu of the last ten files used in that slot.
- A name text box that overrides the legend label — useful when both fixed files share similar filenames.
- A Fixed2 enable checkbox that toggles the third file in and out of every plot and the spectrogram Source dropdown without unloading it.
- An Auto-wav-diff tick that re-runs analysis automatically whenever a file path changes.
MLD / MAD / SSNR Report window
Opens via the Report button (#2) after analysis has run. The window shows:
- A per-channel table of MLD, MAD, SSNR (and Diff) for both Fixed vs Float and Fixed2 vs Float when Fixed2 is loaded.
- The worst-channel callout, with a Jump to sample button that drives the main DUT spinner.
- Copy (clipboard) and Export CSV actions for paste-into-spreadsheet workflows.
Settings
Open via ⋮ → Settings. Wave Compare contributes a section covering file-history length, auto-wav-diff behaviour, default per-curve plot styles, spectrogram window defaults, and the play-span-only default. The same page hosts the Appearance theme picker (System / Light / Dark) at the top — applied on restart.
Keyboard and mouse
- F1
- Opens this help page in the embedded browser.
- Mouse wheel (in any plot)
- Zoom both axes around the cursor.
- Shift + wheel
- Zoom the time axis only.
- Ctrl + wheel
- Zoom the value (or frequency) axis only.
- Right-click + drag
- Pan within a plot.
- Drag & drop a .wav onto the window
- Loads the file into the currently-focused file slot.
- Esc
- Stops playback if running.
Troubleshooting
- No metric markers appear after loading files.
- Click Run MLD / MAD / SSNR analysis — marker placement is computed only after analysis runs. If markers still don't appear, check that both files have the same sample rate, channel count, and length (or are close enough that the diff computation completes).
- The Report button is greyed out.
- The Report unlocks only after at least one of MLD / MAD / SSNR has cached results. Run analysis first; if it has been running, check the status row (#9) for an error message.
- Playback does nothing or shows "Nothing to play."
- Both Float and Fixed must be loaded before playback works (Mantissa lines them up sample-for-sample). If the issue persists with both loaded, check the Play span only tick — an empty span selection yields no audio.
- Live mode never refreshes.
- Live mode watches the Fixed file's modification time. If your build
writes a new file rather than overwriting the existing one (e.g. with
a timestamped name), update the Fixed file path manually after each
build. The watcher fires only when the path's
mtimechanges. - The Fixed2 column is missing from the Report.
- Open the Files panel and ensure both the Fixed2 path is loaded and the Fixed2 enable checkbox is ticked.
- Plot colours look wrong after restart.
- Per-curve plot styles persist in
settings.json. To reset, delete thespan_line_stylesentry from%APPDATA%\mantissa\settings.json(Windows) or~/.config/mantissa/settings.json(Linux/macOS) and restart.