Debugger
Debugger mode binds to a paused debug session (Visual Studio, GDB, or VS Code via DAP) and lets you inspect fixed-point buffers live — comparing them sample-by-sample against their floating-point references on synchronised plots. Use it while iterating on a fixed-point port to see exactly where the integer arithmetic diverges from the float reference.
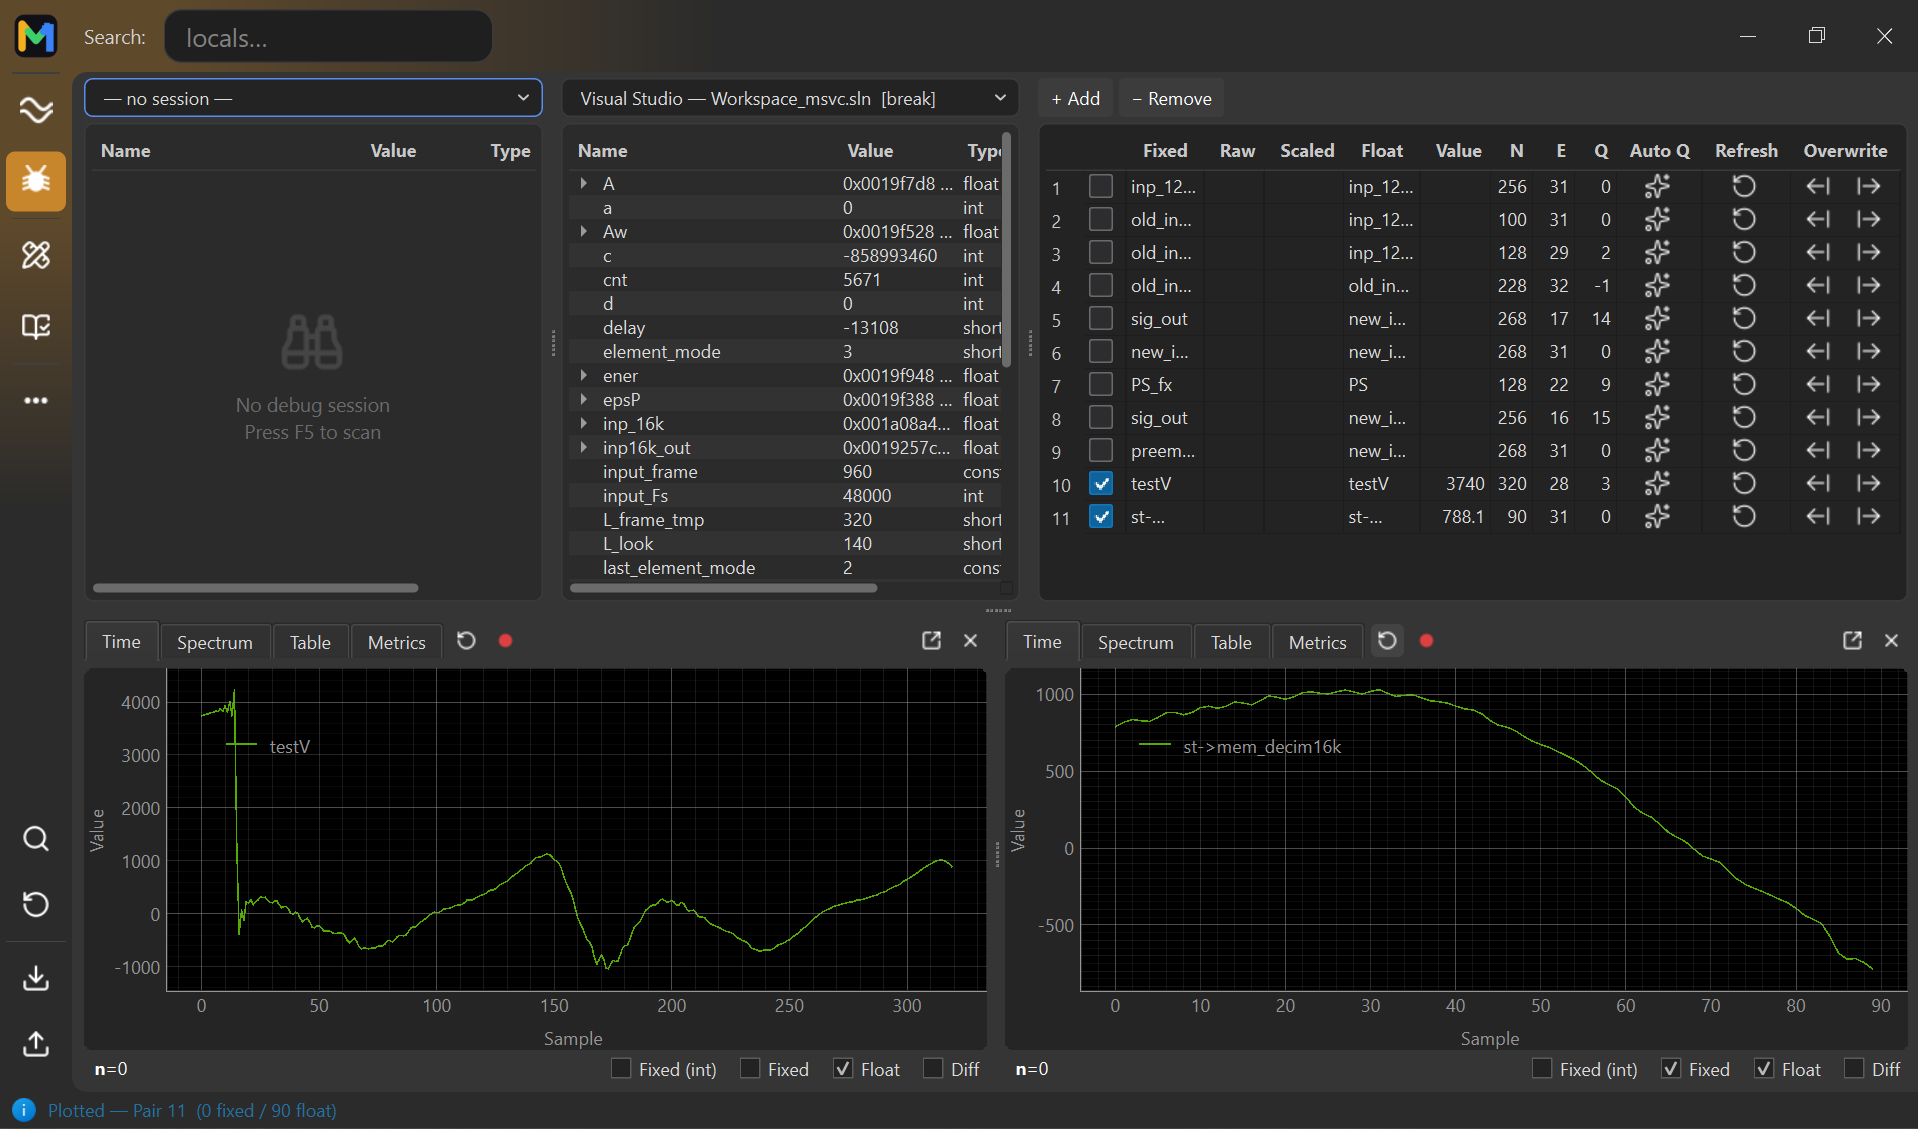
The numbered badges around the screenshot are clickable — each one jumps to its section in the Interface reference below.
Quick start
To inspect a fixed-point buffer against its float reference:
- Pause your code at a breakpoint in Visual Studio, GDB, or VS Code. Then in Mantissa press F5 (or open the Instance B dropdown #4) — Mantissa scans for active debug sessions and lists them.
- Pick the session. The locals tree fills with the variables in scope. Type in the Search box (#1) to filter by name.
-
Click + Add in the Watch Pairs panel
(#5) and bind a fixed-point buffer to its float
reference. Mantissa reads both, scales the fixed by
2^-Q, and computes the per-sample diff. - Tick the pair's row checkbox. The embedded Time plot (#7) shows the Float reference and the scaled Fixed candidate overlaid. The status row (#9) confirms how many samples were read from each side.
Tip. Don't know the Q-format? Click the Auto Q icon in the pair's row. Mantissa infers Q from the fixed↔float ratio and types it into the Q cell.
Common workflows
Verify a fixed-point port matches its float reference
- Open the Files panel and load both float and fixed paths.
- For each variable pair (float / fixed), click + Add and bind them with the right Q-format.
- Tick the row to plot. Switch to the Diff overlay tab on the Time plot to see the per-sample mismatch.
- Open the Metrics tab (#6) for a summary: estimated Q, fixed-buffer headroom in bits/dB, and the best-precision Q the float values would fit into.
Discover an unknown Q-format from data
- Bind the pair with Q = 0 as a placeholder.
- Click the Auto Q icon in the pair's row.
Mantissa computes
log2(mean(raw / float))across all aligned non-zero samples and writes the rounded result into Q. - Check the Metrics tab to confirm: the estimated Q should now match the displayed Q within a fraction.
Push a corrected value back into the debug session
- With a watch pair checked, scroll to the row's Overwrite button (the right-arrow icon at the end of the row).
- Click it. Mantissa writes the float-side values into the fixed
buffer (scaled by
2^Q) in the running debug session, so you can step a few cycles further and see how the rest of the pipeline behaves with a known-good input. - Resume the debugger from the IDE; the next refresh shows the new state.
Compare two debug sessions side by side
- Attach Instance A (#3) to your reference build and Instance B (#4) to the build under test.
- Browse the same variable in both locals trees, or expand the same struct path.
- Use the Watch Pairs panel to bind a buffer from Instance A to its counterpart in Instance B for a cross-build comparison.
Interface reference
1 — Title bar & Search
The strip across the top carries the app logo, a global search box that filters every visible locals tree, and the standard window buttons.
- Search box
- Type to filter the locals tree by variable name. Matches are highlighted in both Instance panels simultaneously. Enter jumps to the first match; ↑ / ↓ walks through successive matches. A search-step counter appears in the field once there are multiple hits.
- Mantissa logo
- Click to return to Home (Web env).
2 — Action buttons (left rail)
Debugger-specific actions for managing the live session and snapshots.
- Scan (binoculars)
- Re-scan for active debug sessions. Equivalent to opening either Instance dropdown and refreshing it. Bound to F5.
- Live mode (rotating arrow)
- Toggles automatic refresh of every checked watch pair at the configured interval (default 1 s). Lit red while live. Useful when you want the plots to update in lockstep with your debugger stepping through frames.
- Save snapshot (download)
- Dumps the current pair data + Q-formats + plot state to a JSON snapshot file. Useful for offline review or attaching to bug reports.
- Load snapshot (upload)
- Restores a previously-saved snapshot, replaying the pair plots without needing a live debug session. Lets you walk through a historical capture sample-by-sample.
3 — Instance A panel
The left workspace panel hosts one of the two parallel debug-session viewers. Each instance has:
- A session picker at the top (the "— no session —" / "Visual Studio — …" dropdown). Open it to see all active debug sessions Mantissa discovered.
- A locals tree below — variable name, current value, and resolved type, expandable for structs and pointers. Empty when no session is attached, showing the No debug session — Press F5 to scan hint.
The two instances are independent: you can attach Instance A to one process and Instance B to another (different builds, different VMs, etc.), or leave one empty and only use the other.
4 — Locals tree (Instance B)
The middle workspace panel — same structure as Instance A but typically the one you actively work with. The screenshot shows it attached to a paused Visual Studio session, listing locals from the current stack frame:
- Click a variable to use it as the source when adding a watch pair.
- Expand structs / pointers by clicking the ▶ disclosure triangle. Mantissa fetches member values lazily so big structs don't slow the read.
- Hover a row to see the full type signature in a
tooltip — handy for IVAS/EVS code where
Word16vsWord32distinctions are essential. - The Search box (#1) filters this tree live. Press Enter to focus the first match.
5 — Watch Pairs table
The right workspace panel is where the actual fixed↔float comparison happens. Each row is a pair — a fixed-point buffer bound to its float reference, with Q-format metadata. Columns:
- # + tick box
- Row number and the per-pair plot toggle. Up to two pairs can be plotted in the embedded views below; ticking a third opens a "popout-or-skip" prompt.
- Fixed / Raw / Scaled
- The fixed-side identifier (variable name or expression), the raw
integer values just read, and the scaled samples
raw / 2^Q. Click any cell to copy. - Float / Value
- The float-side variable and its read values. Used as the reference when computing Diff and headroom.
- N
- Sample count of the read. If fixed and float lengths differ, the Diff is computed over the intersection.
- E / Q
- The fixed-point format. Q is the number of fractional
bits; E is the integer bits (
E = bits − 1 − Qfor signed types). Edit either cell to rescale on the fly. - Auto Q ( )
- Infer Q from the data:
log2(mean(raw / float))over aligned non-zero samples, rounded to the nearest integer. - Refresh (rotating arrow)
- Re-read just this row from the debugger. Use it after stepping one frame in the IDE to update only this pair without polling everything.
- Overwrite (right-arrow)
- Push the float side's values into the fixed buffer (scaled by
2^Q) in the running debug session. Lets you patch a buffer with a known-good input mid-debug and watch what changes downstream.
Right-click a row for "Open plots in new window" (popout the pair into a full PlotTabs window with all features).
6 — Plot tab bar
Above each embedded plot slot. Tabs switch between four views of the selected pair:
- Time
- Sample-domain overlay of Float / Fixed / Diff. The default view.
- Spectrum
- FFT magnitude (Hann-windowed) for each curve, in dB.
- Table
- Per-sample table: raw, scaled, float, diff. Sortable, copy-paste into a spreadsheet.
- Metrics
- Fixed-point analysis: estimated Q (from data), data-vs-applied Q delta, headroom in the fixed buffer (bits + dB given the bit field and signedness), and the best-precision Q for the float buffer.
To the right of the tabs sit the per-plot controls — refresh, record snapshots (timeline scrubber appears after the first snapshot), popout to a separate window, and close (uncheck this pair).
7 — Plot canvas
The actual chart for the selected tab. Common across all four views:
- Wheel zoom: plain wheel zooms both axes around the cursor. Shift+wheel X-only; Ctrl+wheel Y-only.
- Right-click + drag: pan.
- Right-click menu: Plot Style (per-curve colour, opacity, dash pattern), Set Range (explicit X/Y bounds), Export (PNG / SVG / Copy to clipboard).
- The cursor read-out below the canvas shows the sample index, timestamp, and each curve's amplitude at the mouse position.
8 — Curve checkboxes
Below each plot, four checkboxes toggle individual curves:
- Fixed (int)
- Off by default. Toggles the raw stored integers as a dashed line. Lives at the integer scale (±2bits−1) so the Y-axis blows up when you turn it on — useful for inspecting the actual stored ints, less so alongside the scaled curves.
- Fixed
- The scaled fixed values (
raw / 2^Q) — what the algorithm "thinks" the values are. - Float
- The float reference. On by default.
- Diff
- Per-sample difference (Fixed − Float). On by default for the Diff-prioritised flow.
9 — Status row
The strip across the very bottom shows the most recently plotted pair's index and the read totals (e.g. Plotted — Pair 11 (0 fixed / 90 float)), along with any transient status messages (read errors, session lost, etc.). A 0 fixed count typically means the fixed-side read failed — see Troubleshooting.
Additional panels
Popout plot window
Right-click any Watch Pairs row and pick "Open plots in new window", or click the popout icon (square with arrow) on an embedded plot. The pair opens in a standalone window with the full PlotTabs UI — Time, Spectrum, Table, and Metrics tabs, snapshot recording, plot styling, and the same right-click options. Popped-out windows are not live (they don't auto-refresh) so they capture a frozen snapshot you can explore at leisure.
Metrics tab
Inside any embedded or popped-out plot, the Metrics tab shows a detailed read-out of the pair's fixed-point analysis:
- Buffer — sample count, fixed storage field (bits + signedness), full-scale value.
- Q-format (applied) — currently-applied Q, integer bits (E), LSB resolution, value range.
- Q-format (from data) — Q inferred from the raw↔float ratio, with a green ✓ when it matches the applied Q or an amber Δ flag when it doesn't.
- Fixed headroom — peak |raw|, % utilisation of full scale, and remaining headroom in bits and dB. Tells you how much you could amplify the integer values before clipping.
- Float → best-precision Q — the Q that would pack the float buffer into the bit field with maximum fractional precision while still holding its peak without overflow.
The VS Code extension
Why is the extension needed?
Mantissa's Debugger reads variables live from a paused debug session. Visual Studio exposes that to Mantissa automatically, but VS Code keeps its debug session private to the editor — so Mantissa can't see a VS Code session on its own. The Mantissa Bridge extension opens a small loopback bridge that lets Mantissa read your fixed-point buffers while you're stopped at a breakpoint.
With it installed, every VS Code debug session —
gdb/cppdbg, LLDB, cppvsdbg,
debugpy, CodeLLDB — shows up in the Instance dropdown
automatically, with no launch.json edits. Without it,
Mantissa's Debugger can only connect to Visual Studio or a standalone
GDB session.
Installing it
It installs the same way on every OS, which is why it's the recommended path over the standalone GDB bridge.
Or install it from a terminal:
code --install-extension mantissa.mantissa-bridgeThat's all the setup there is. Start any debug session, hit a breakpoint, then press F5 in Mantissa and the session appears in the Instance dropdown. Two optional extension settings:
mantissa.bridge.enabled- Default
true. Turn the bridge off without uninstalling the extension. mantissa.bridge.host- Default
127.0.0.1. The address the bridge listens on — loopback only by default.
Settings
Open via ⋮ → Settings. Debugger contributes three sections to the unified Settings page:
- Live mode — refresh interval for the live-mode polling loop.
- Locals auto-refresh — separate polling for the locals tree so the Value column stays fresh without manually clicking Refresh.
- GDB bridge (standalone gdb) — installs the
gdb_bridge.pyplugin into~/.gdbinit, so standalone gdb sessions (terminal, WSL, remote gdbserver) are discoverable. - VS Code (DAP) — points you at the
Mantissa Bridge VS Code extension, which exposes
every VS Code debug session (gdb/cppdbg, lldb, cppvsdbg, debugpy,
CodeLLDB) to Mantissa with no
launch.jsonedits.
Keyboard and mouse
- F1
- Opens this help page in the embedded browser.
- F5
- Re-scan for active debug sessions.
- Enter (in Search)
- Jump to the first matching variable.
- ↑ / ↓ (in Search)
- Step through successive matches.
- Mouse wheel (in a plot)
- Zoom both axes around the cursor.
- Shift + wheel
- Zoom the time / X axis only.
- Ctrl + wheel
- Zoom the value / Y axis only.
- Right-click + drag
- Pan within a plot.
- Right-click a pair row
- Open the pair's plots in a separate window.
Troubleshooting
- No sessions appear in either Instance dropdown.
- Two cases. (a) Your debugger is running but isn't paused — Mantissa can only read state while the debuggee is broken at a breakpoint. Hit a breakpoint, then press F5. (b) Your debugger is fine but Mantissa can't see it. For Visual Studio, no setup is needed beyond launching VS. For GDB or VS Code, install the integration: Settings → GDB bridge for standalone gdb, or the Mantissa Bridge VS Code extension for VS Code-hosted sessions.
- The status row says "0 fixed / N float".
- The float-side read succeeded but the fixed-side returned zero samples. Common causes: (a) the fixed expression is invalid or out-of-scope at the current breakpoint — try expanding the variable in the locals tree to confirm it resolves; (b) the buffer is a pointer-arithmetic expression that gdb can't auto-size — type an explicit count into the N column; (c) the backend hit a transient COM/RPC failure — click the per-row Refresh button to retry.
- The Headroom value looks wrong (e.g. 17 bits for a
short). - The backend couldn't determine the buffer's true bit width and
fell back to 32-bit signed. Check that the variable's declared
type is resolvable in the debugger (e.g. for an expression like
buf+128the element type comes from the base identifierbuf). The Metrics tab is the easiest place to verify — it shows the bit field next to the headroom number. - Auto Q gives a value that doesn't match my code.
- Auto Q uses
log2(mean(raw / float))over aligned non-zero samples. If the float buffer is mostly zero (silent pre-roll), or if the pair length doesn't match, the estimate drifts. Pick a span containing real signal, or use the Metrics tab's Float → best-precision Q suggestion as an alternative. - The Refresh button on a pair never finishes.
- The session may have ended without notifying Mantissa (e.g. the debuggee crashed). Re-open the Instance dropdown to confirm the session is still listed; if not, press F5 to re-scan.
- Live mode plots all the pairs at once and slows the debugger.
- Live mode polls every checked pair every cycle. Untick pairs you're not actively watching, lower the refresh interval in Settings → Live mode, or pop heavy pairs into separate windows (they won't refresh).